Service Center Awareness Campaign
This campaign was developed over a three-month period. After reviewing web performance data, I identified a significant decline in service center page views from early June through the end of August. In response, I proactively implemented initiatives to increase visibility and traffic to the page.
Following the identification of a drop in page views, I developed web and social creative assets that showcased the dealership’s unique service features. I also recommended repositioning these assets higher in the rotation to enhance visibility and drive increased user engagement.
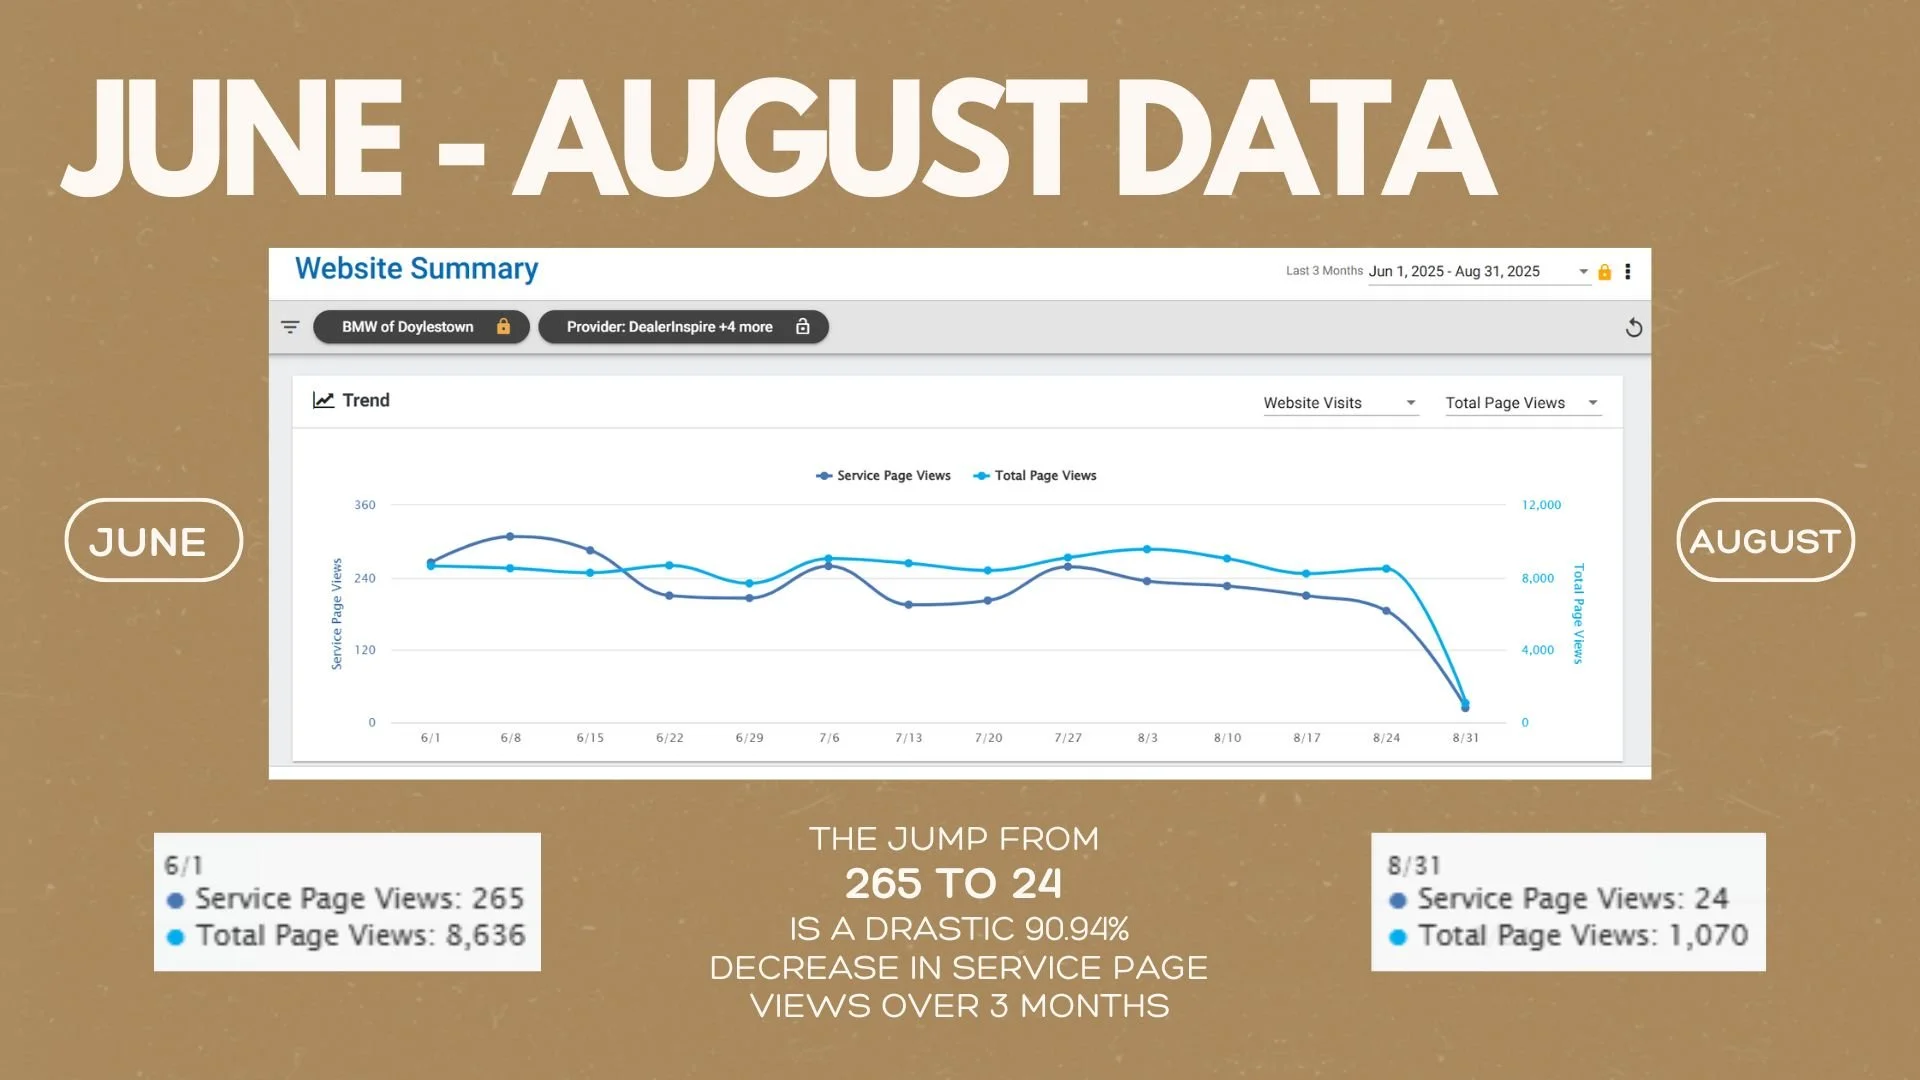
This data highlights a significant decline in performance, with service page views dropping from 265 on June 1st to 24 on August 31st. Over the same period, total page views decreased from 8,636 to 1,070.
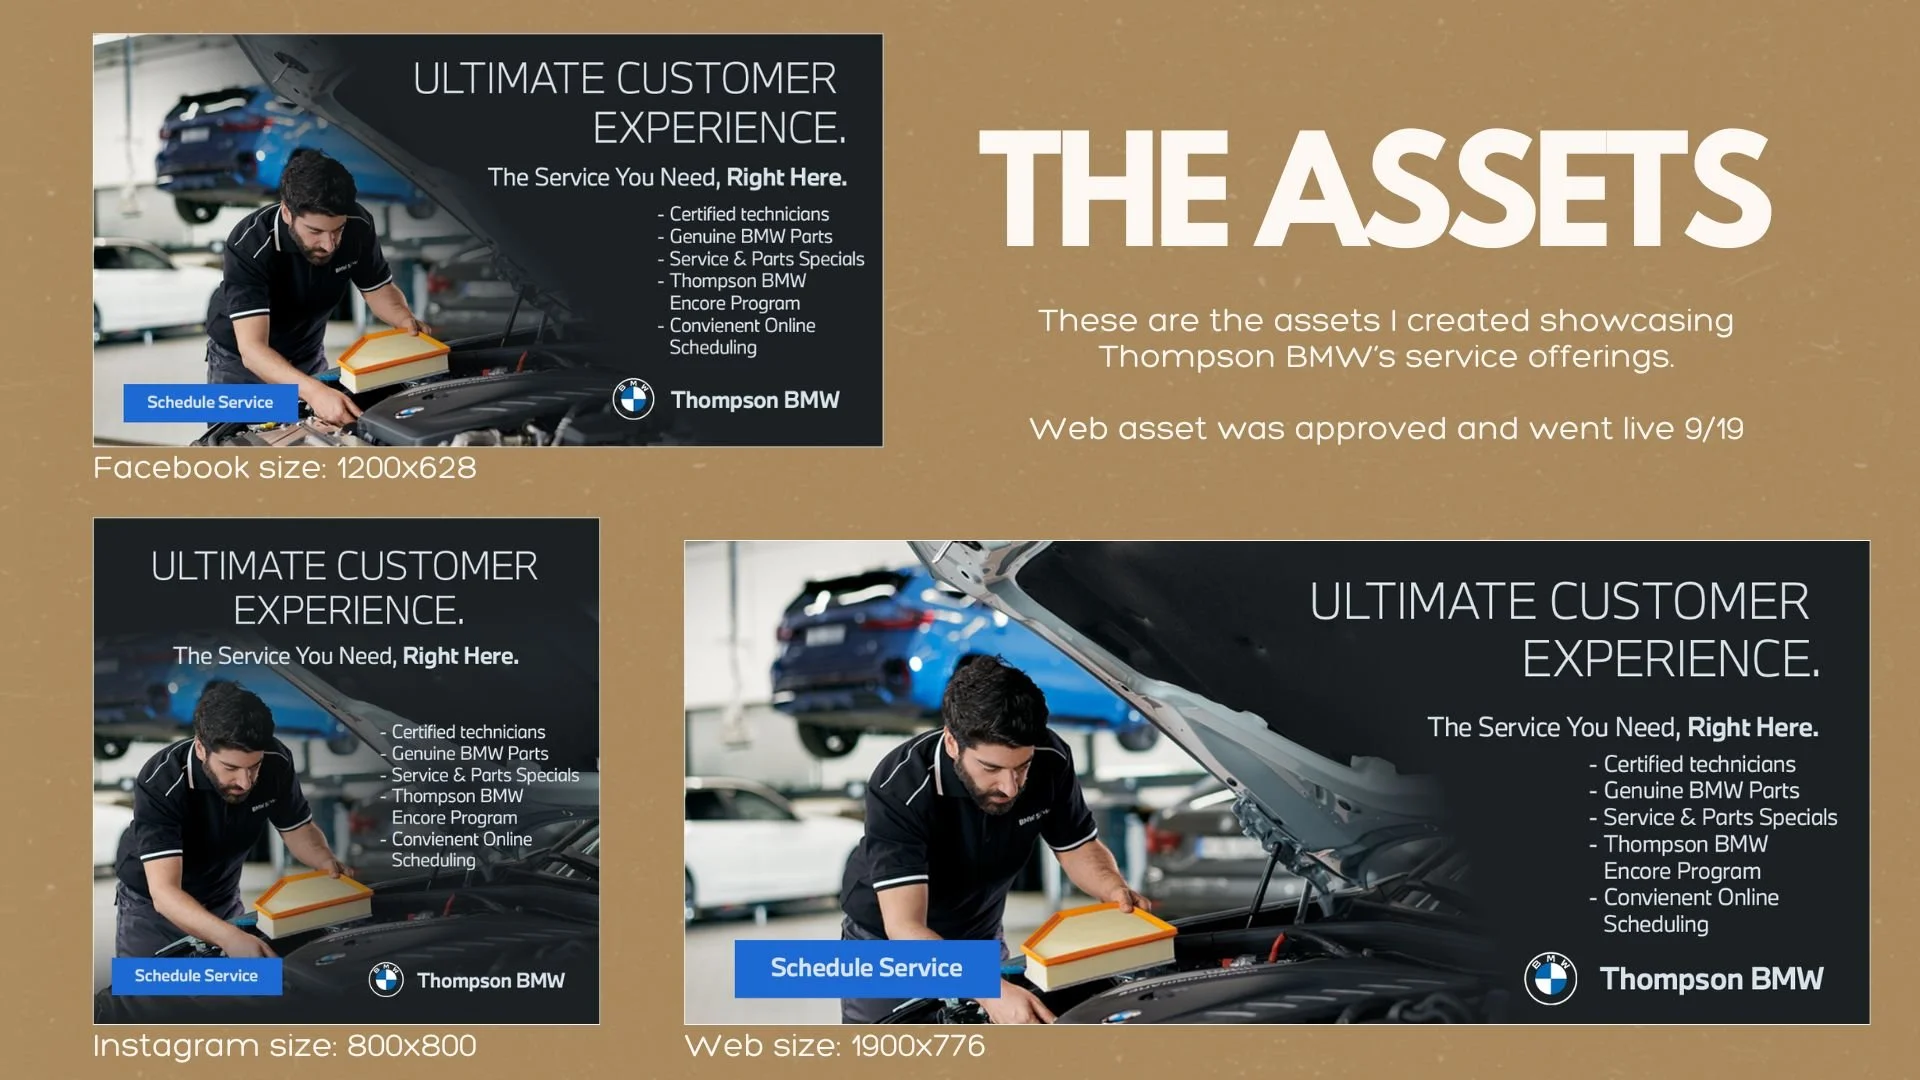
I created these custom banners for web, Instagram, and Facebook to promote the dealership’s service offerings and increase visibility across digital channels.
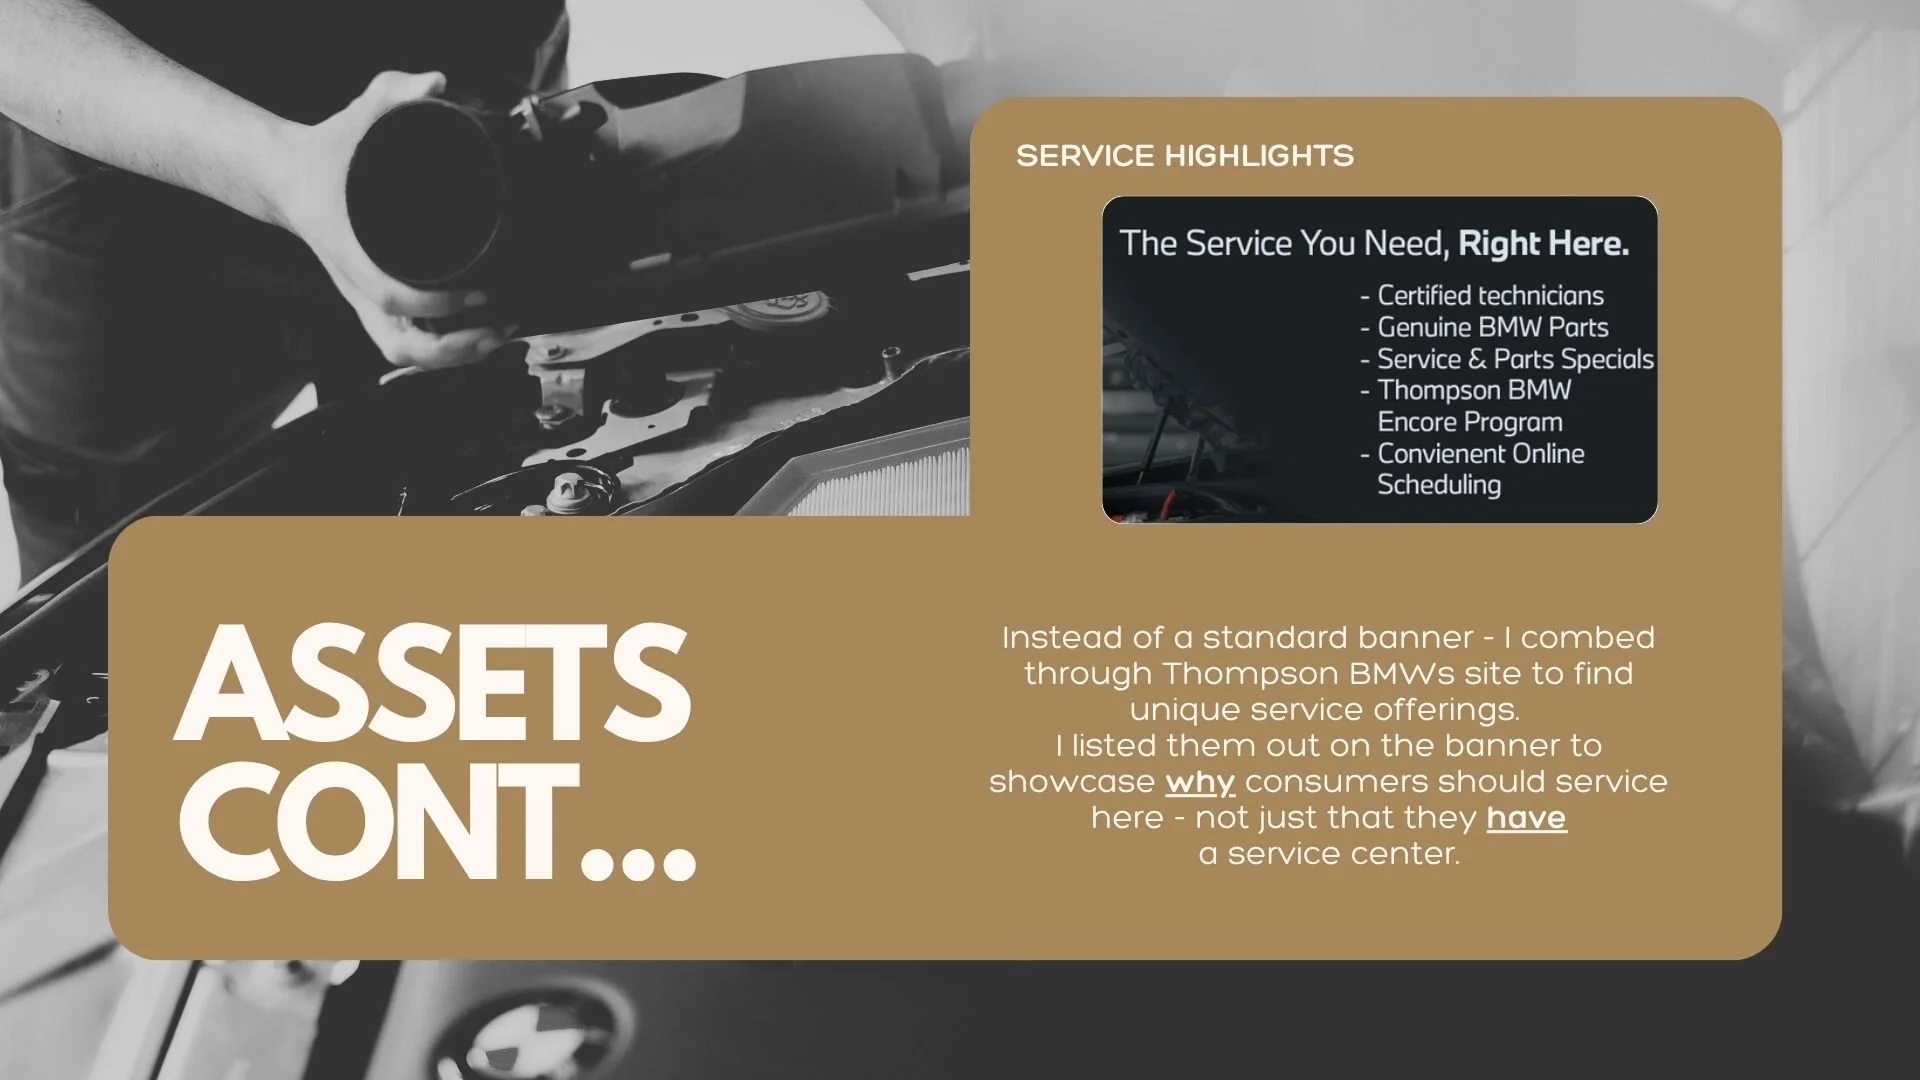
Rather than defaulting to a standard service banner, I took a more strategic approach by reviewing the dealership’s website to identify unique service offerings and emphasizing key value propositions that demonstrate why customers should choose this service center.
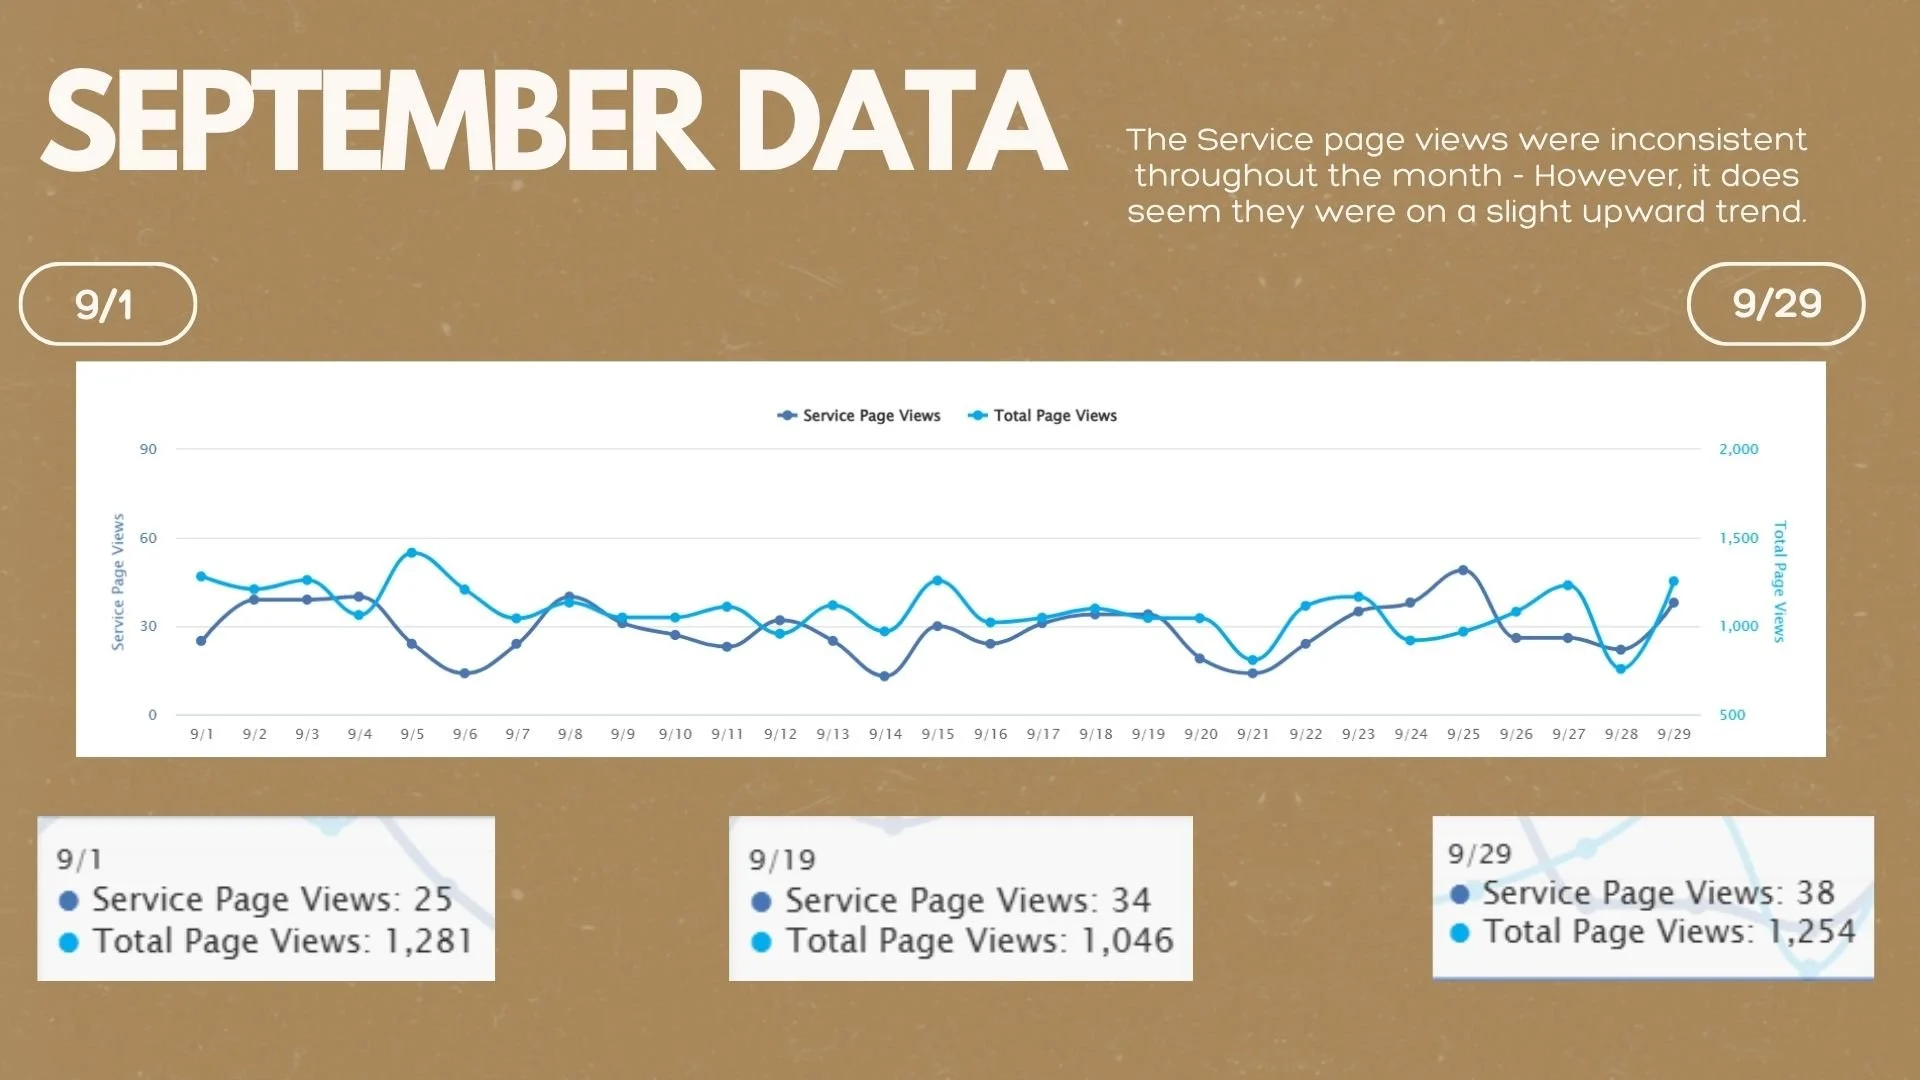
Page views in September fluctuated but showed a gradual upward trend, increasing from 25 views on 9/1 to 34 views on 9/19 and 38 views on 9/29.
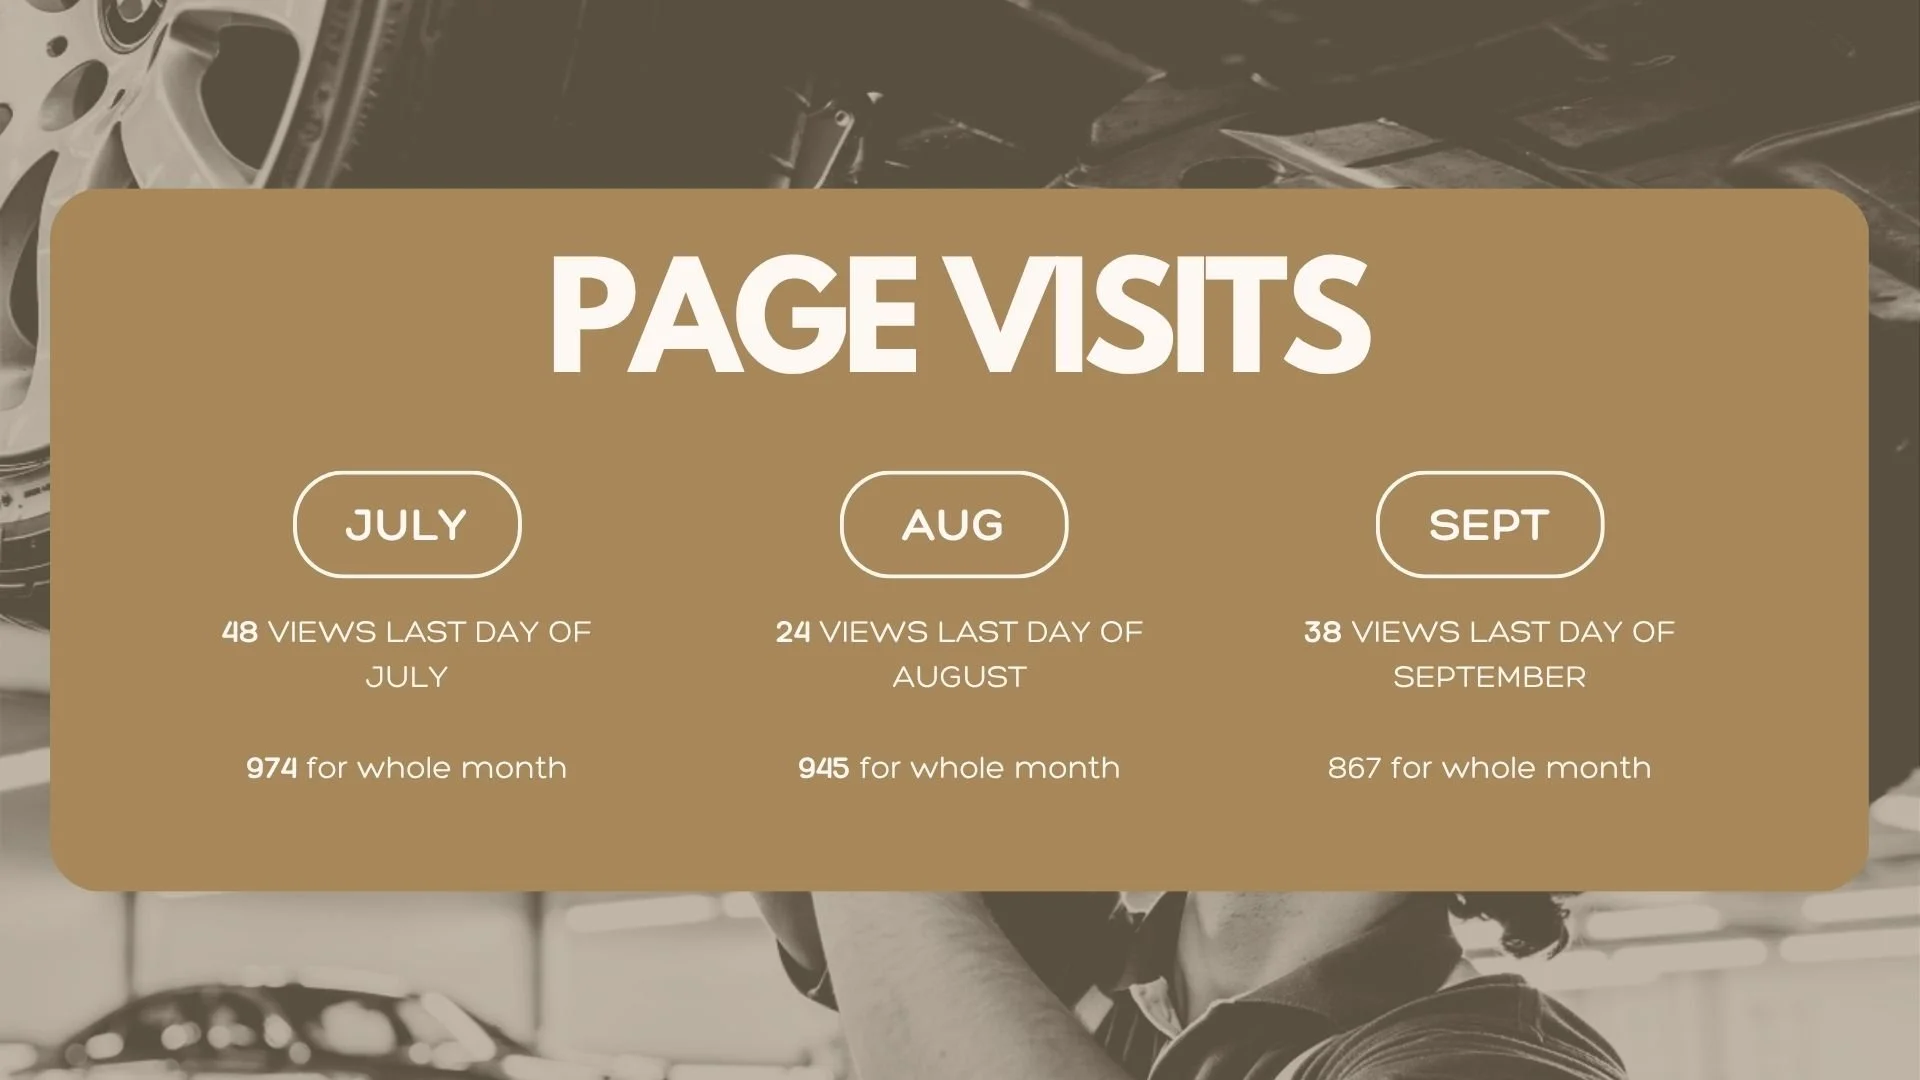
Page visits showed a slight increase at the end of the period, rising from 24 to 38. However, overall monthly page views decreased slightly from 945 in August to 867 in September.
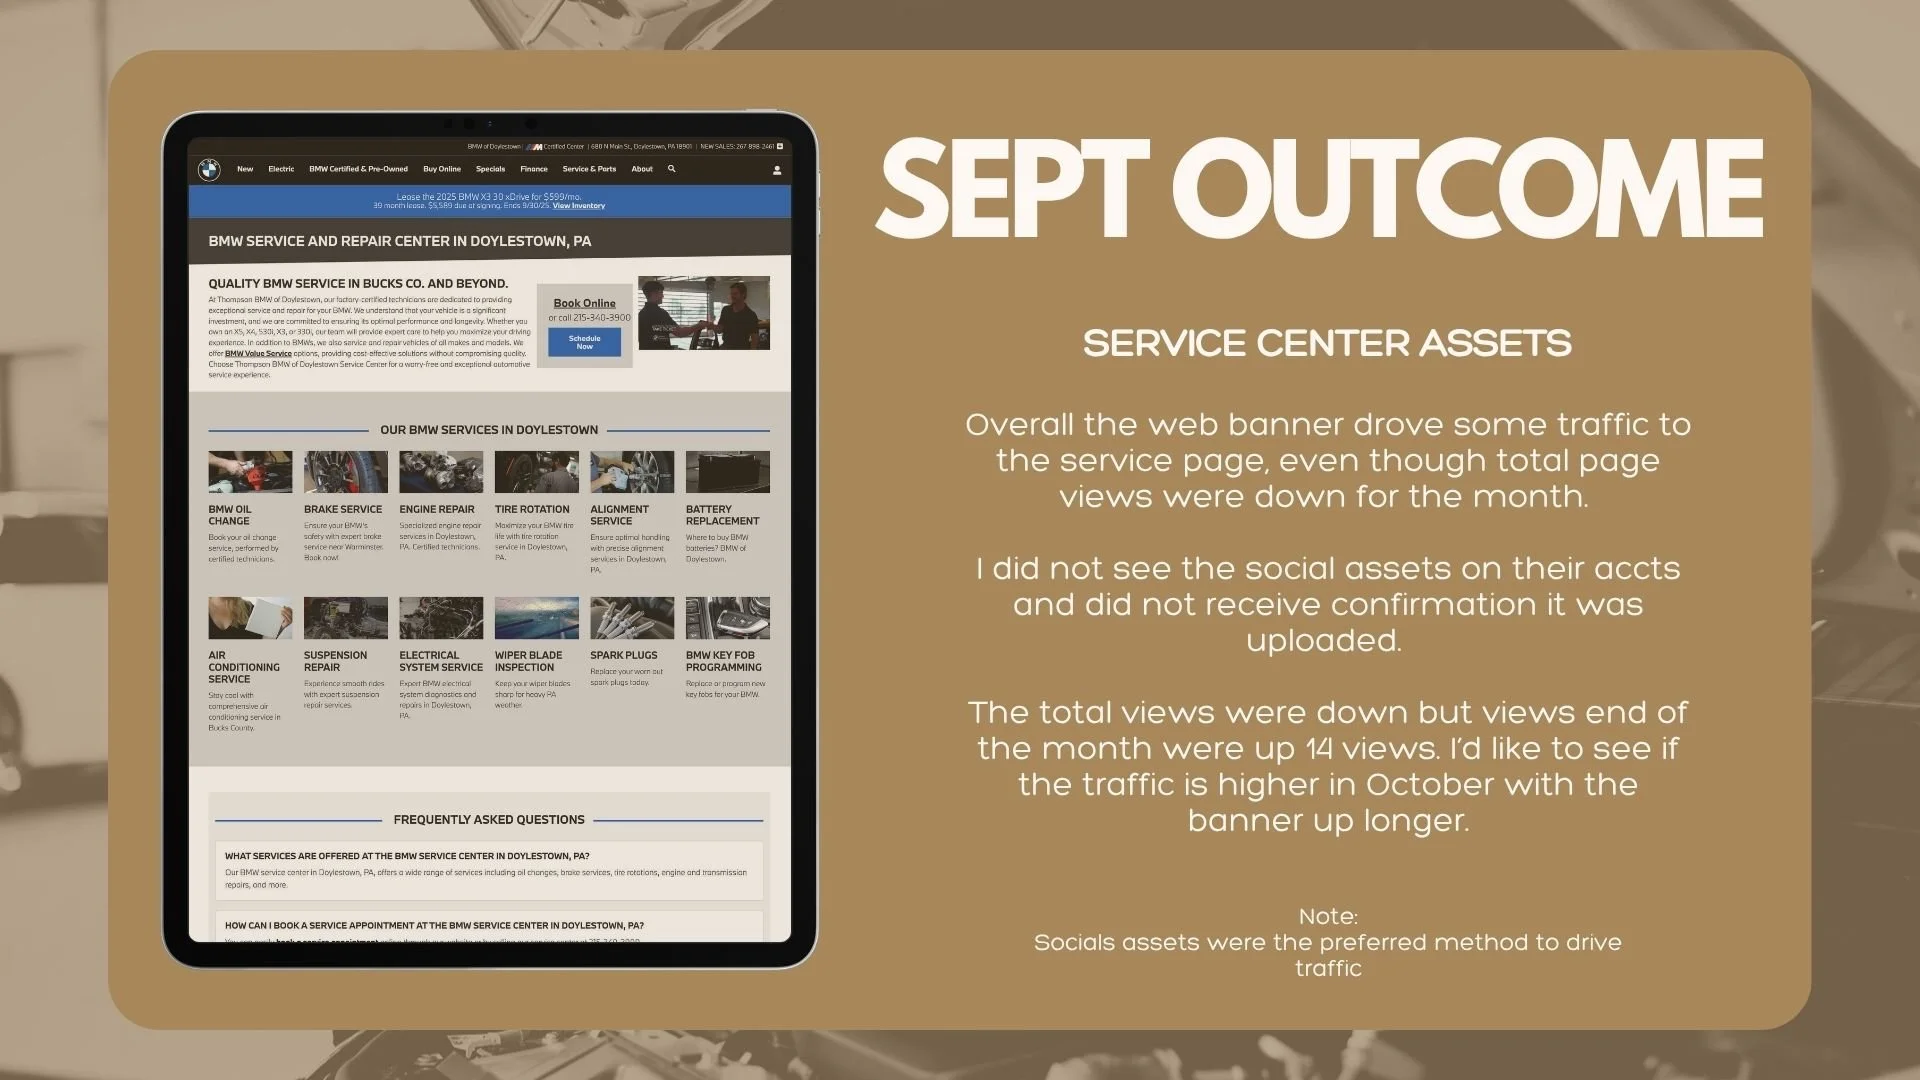
The banners did contribute to traffic to the service page, even though total views declined for the month of September. Social assets were not published, which limited my ability to fully support distribution across channels. Despite the overall decrease in traffic, there were isolated spikes in page views following implementation. Performance monitoring continued as the banners remained live to better assess impact.
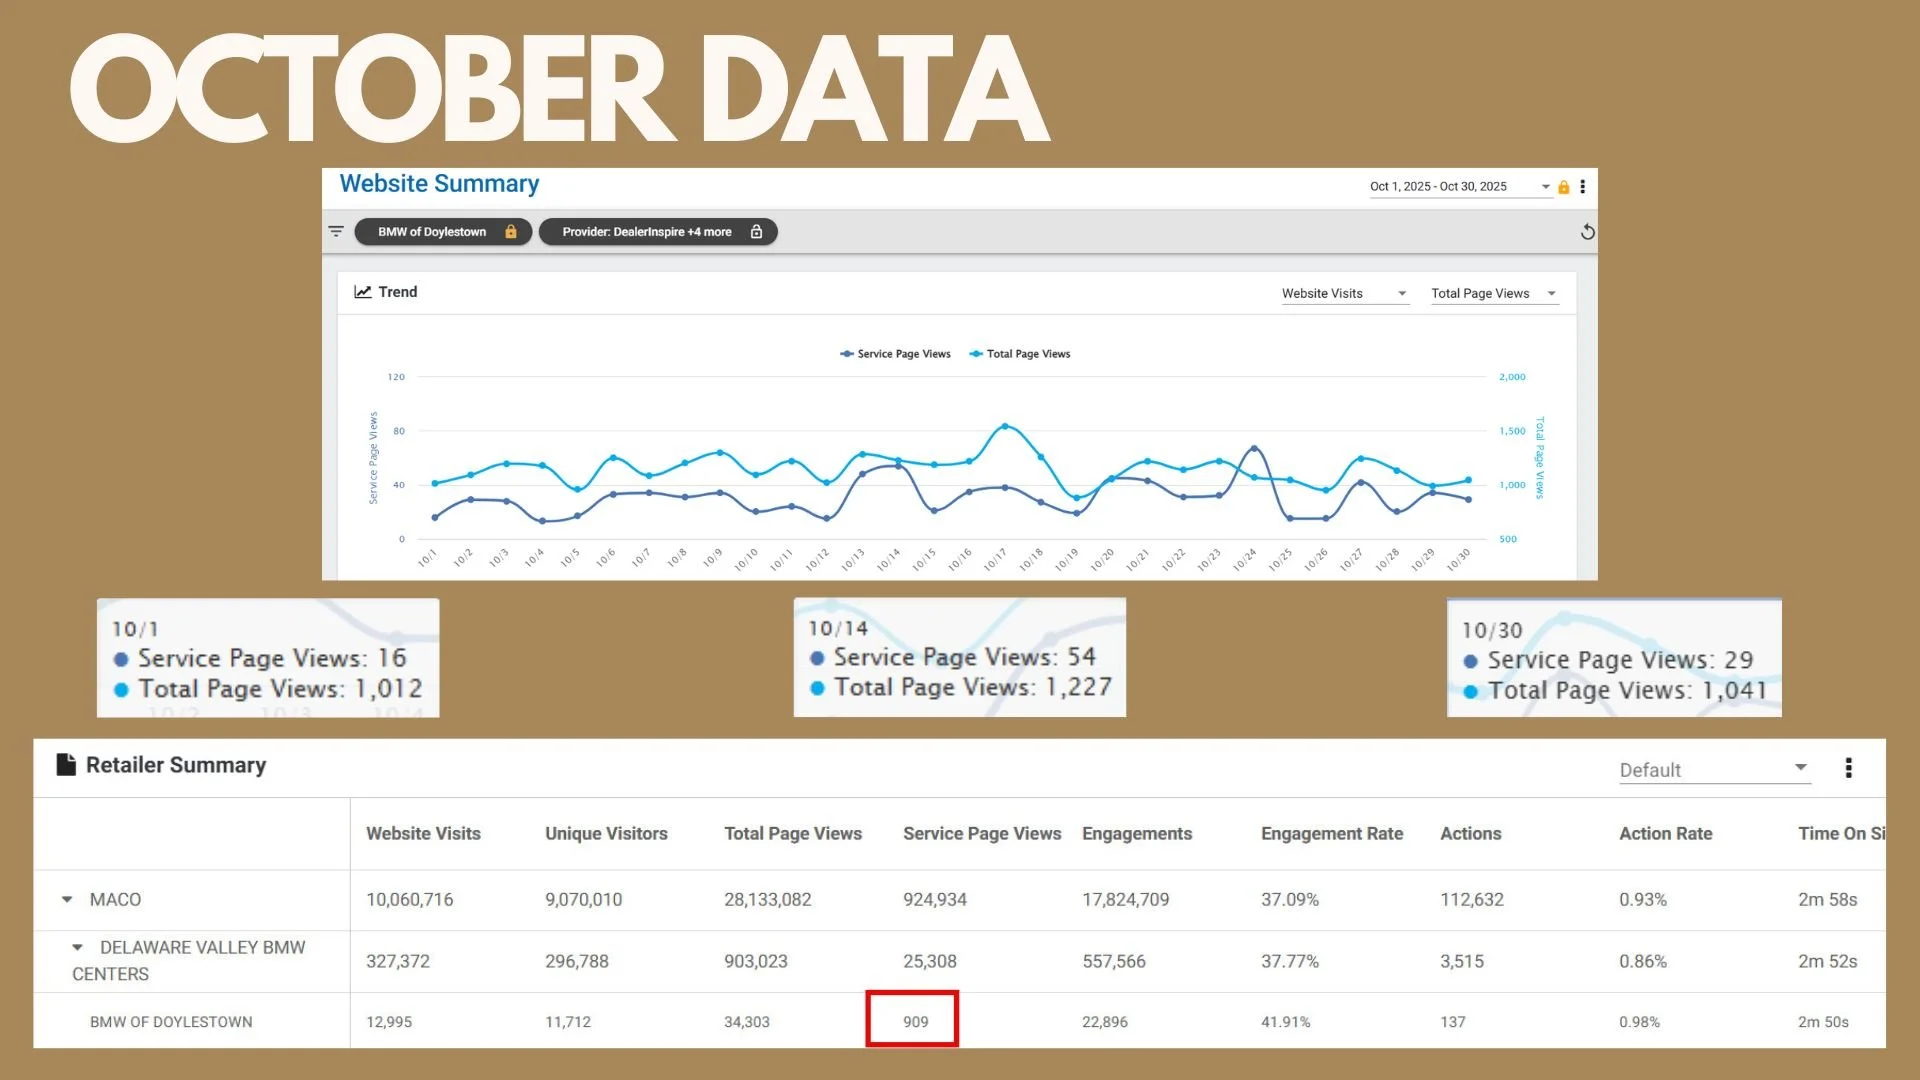
Page views in October showed an increase compared to September, with daily views rising from 16 on 10/1 to a peak of 54 on 10/14, and 29 on 10/30.
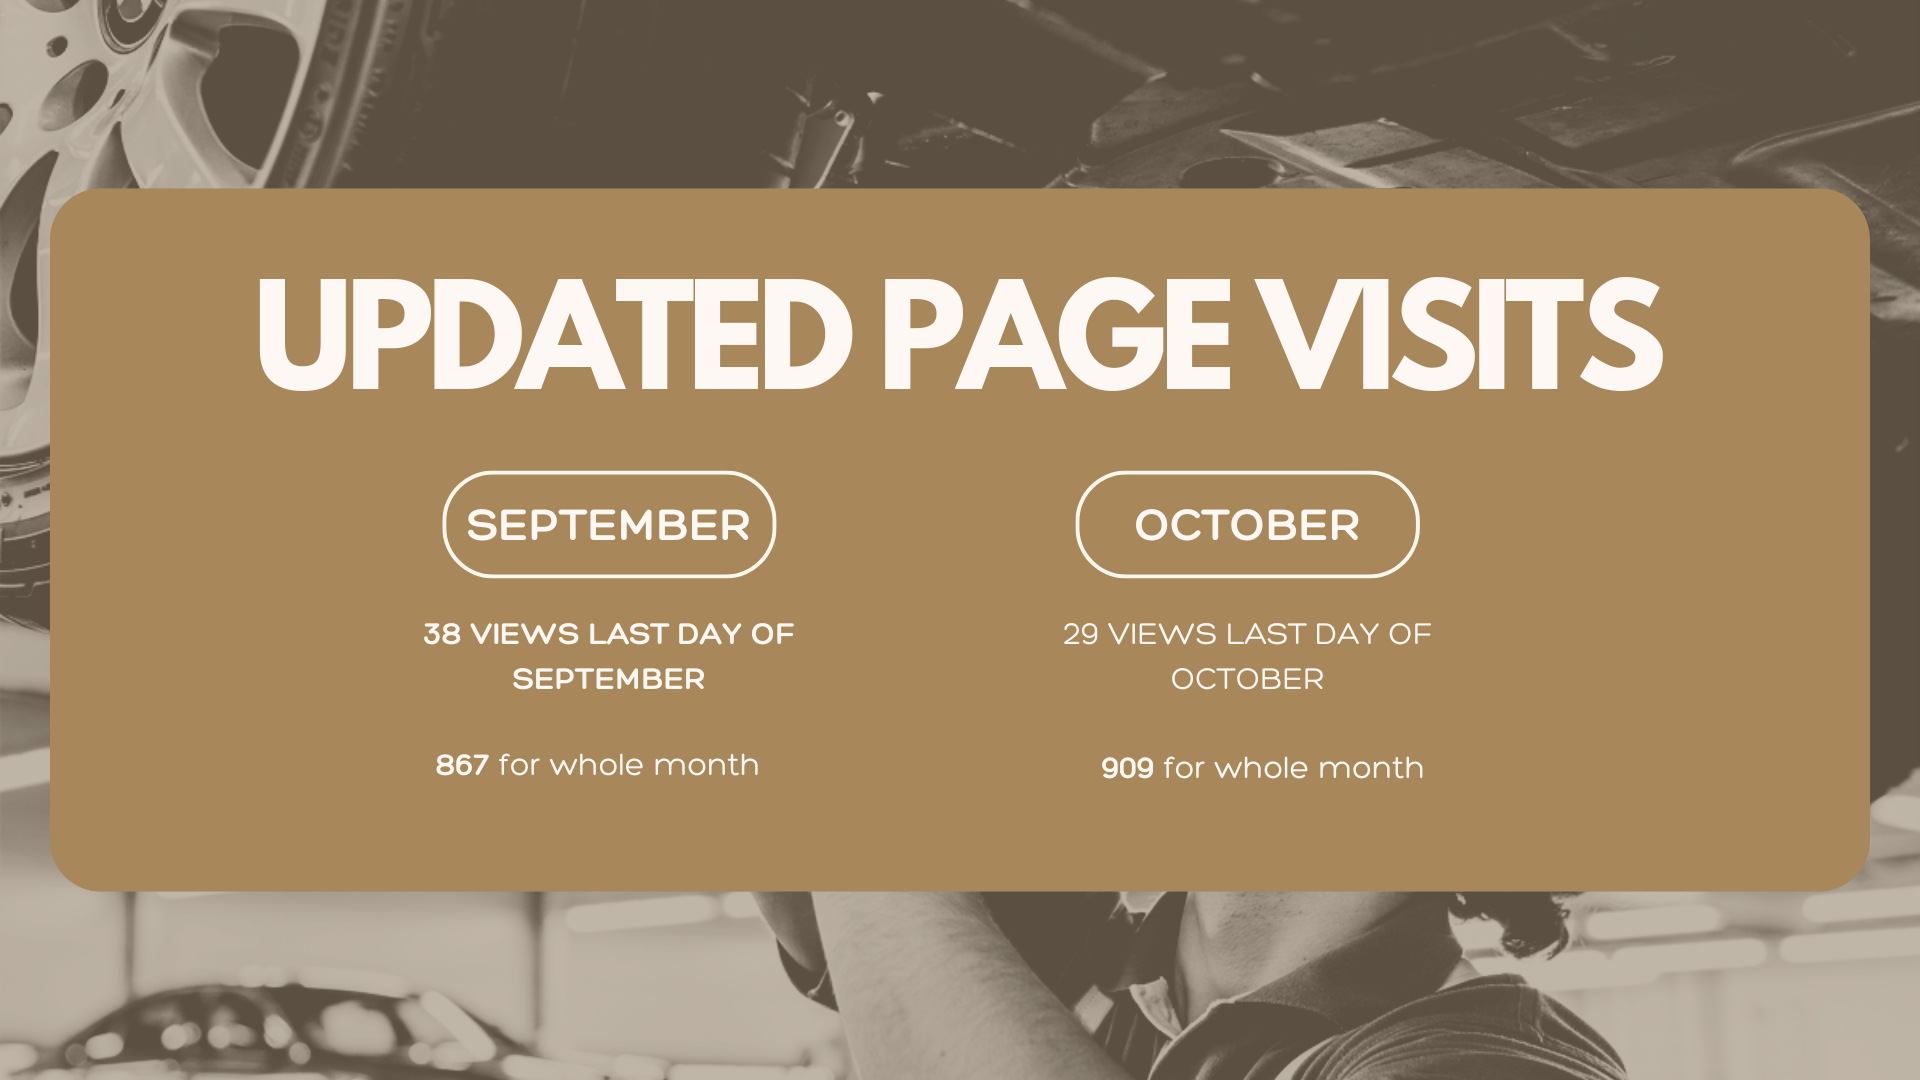
Although page views were slightly lower on the final day of October compared to September, overall performance improved, with total monthly views rising from 867 in September to 909 in October.
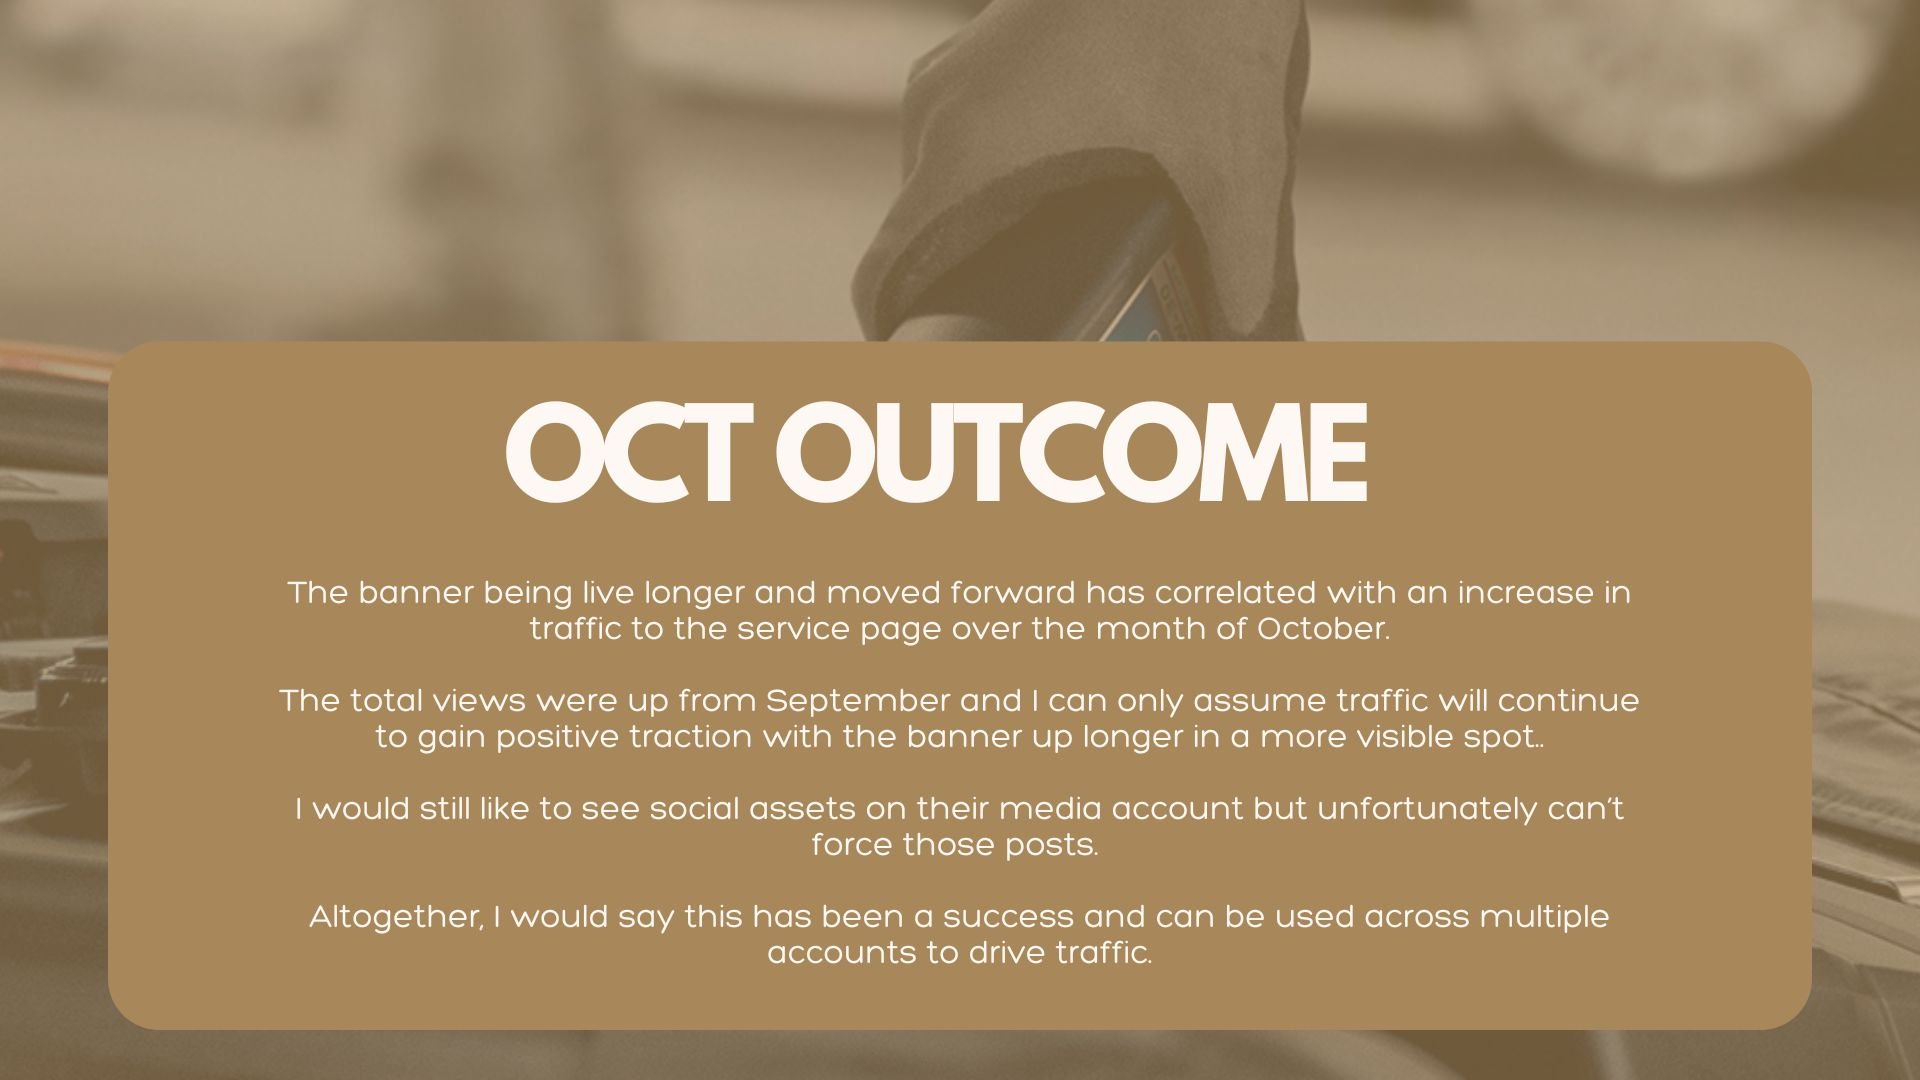
With the extended duration of the banner campaign, page views showed a positive improvement throughout October. Total monthly views increased, suggesting improved performance over time as the assets remain live. While social assets were not posted, limiting full cross-channel support, recommendations were made based on observed performance data. Overall, the dealership expressed satisfaction with the results achieved during the campaign period.